Home
/
Resources
/
Infographic - Sponge in 2014
Infographic - Sponge in 2014
Date:

It's been a great year at Sponge so here's a summary of 2014 as an infographic:
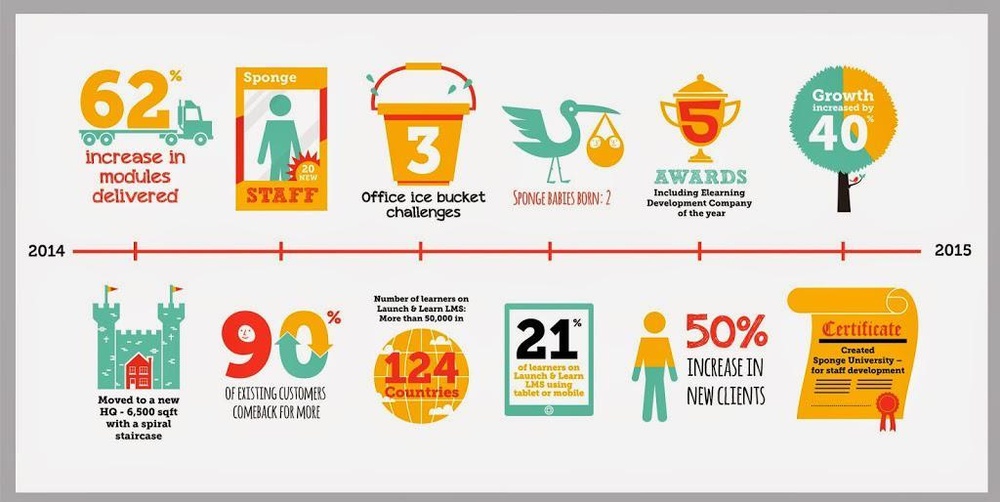
The key facts from the 2014 Sponge infographic are:
- 62% increase in modules delivered
- 20 new Sponge staff
- 3 Office ice bucket challenges
- 2 Sponge babies born
- 5 Awards, Including Elearning Development Company of the year
- Growth increased by 40%
- Moved to a new HQ - 6,500 square foot with a spiral staircase
- 90% of existing customers comeback for more
- More than 50,000 learners on Sponge's Learning Management System (LMS) Launch & Learn
- Learners in 124 countries on the Launch & Learn LMS
- 21% of learners in Launch & Learn LMS using tablet or mobile
- 50% increase in new clients
- Created Sponge University for staff development