Learning Analytics: Fünf Killer-Metriken, die jetzt erfasst werden sollten (engl.)

Welcome to episode two of Expert Views. In this interview with Liz Hardwell, Sponge’s Head of Learning Strategy, we explore how five key metrics can reveal what learning is working in your organisation, and what isn’t.
Click here to jump straight to the video.
As a learning leader it can be difficult to determine what data you should be tracking to report on impact. In our work, we see clients at two ends of a spectrum; on one end swamped with data they are struggling to gain insight from and, on the other, not tracking much beyond SCORM stats and trainee feedback forms. This leads to a problem: the inability to draw insights in a consistent, comparable, and actionable way.
Many L&D teams are at the early phases of data maturity, simultaneously exploring what to track to provide meaningful insights, as well as how best to track it.
If this is you, you’re in good company. Global organisations may be advanced with data in other areas of the business, but findings suggest that L&D is working on ways to catch up.
In this blog, we’ll cover:
- The L&D challenge to stay at the forefront with data
- Video Interview – Five killer metrics: what to track and why
- Metric 1: Time spent within the learning experience and on specific learning activities
- Metric 2: Accuracy – the potential reasons for inaccurate answers
- Metric 3: Judgement – assessing critical thinking and decision-making
- Metric 4: Geography – using learner locations as a lens to assess performance
- Metric 5: Engagement – how much are learners really learning?
- Making the most of the metrics going forward
The L&D challenge: data, data everywhere.
L&D leaders are actively engaged in the data discussion, asking how it can be used to sharpen their understanding of what learning is working, what needs tuning up, and what can be abandoned.
More than that, these teams have set their sights high, aiming to become data savvy. They want to be able to predict risks their organisation may face, based on today’s employee knowledge.
But increasingly, learning programmes are dynamic. Rather than a ‘one and done’ approach, they’re often a sophisticated mix of assets and resources available over time. Social platforms facilitate informal learning, tracking systems pinpoint issues and invite questions, and online surveys offer qualitative data about a learner’s experience.
To add to the moving parts, many programmes especially in governance, risk, and compliance (GRC), are run as primary and refresher training options, across jurisdictions and in multiple languages. Compounded by the fact that numerous learning initiatives are launched each year, it’s easy to see how keeping tabs on human capital at a single point in time can be a challenge.
Yet, we know organisations are rolling up their sleeves and taking this on and, in several cases, gaining a clear picture of learning impact through just a few key metrics.
Five killer metrics: what to track and why.
In this interview with Liz Hardwell, Sponge’s Head of Learning Solutions, we explore how five key metrics can reveal what learning is working in your organisation, and what isn’t.
They are useful metrics by themselves, but become more powerful when used together, helping L&D teams to analyse performance, predict risks, and assess learning culture.
And the good news is, you’re probably tracking many of them already.
To discover more about learning analytics, read Sponge’s essential guide to learning analytics.
Metric 1: Time.
Time is often one of the more readily available learning analytics. Here’s what the metric of time can reveal about your learning culture and the learning experience itself.
Time to engagement (TTE)
This is the time between a learner receiving notification of a learning experience, and when they begin.
Gaining a picture of TTE can reveal insights into an organisation’s learning culture. For example, if one business area takes an average of three days to engage while another area takes ten days, that highlights potential differences in learning culture (or appetite for learning), compliance environments, or management styles.
The key is to ask, ‘how can we decrease the time to engagement so that learning happens in a timely manner according to the desires and needs of the business?’

Time within the learning experience
This is the time it takes people from start to finish, on average, to complete a single learning experience, or a curriculum of activities.
Here, we’re seeking to understand how long people are taking in light of our expectations. Did they whiz through and complete it faster than we envisioned?
Estimating expected time spent is not as straightforward as it may sound. People may read 10 to 30% slower online than they do printed material, as well as tending to skim digital text. So, we need realistic ranges for expected learning time, accommodating different abilities.
This metric can also be industry specific. For example, in retail and manufacturing, taking employees ‘off the shop floor’ for training needs to be properly planned for. Elsewhere, this metric is valuable to provide a concrete picture of time invested in employee development.
Time on specific learning activities
Looking at how long a learner is spending in a particular scenario or answering a particular question can also be assessed against expectations and average time spent.
Taking a long time? Perhaps this indicates a question that is too difficult, or maybe it’s been poorly phrased. Taking no time at all? This might point to a lack of engagement with the material, or a lack of challenge.
Metric 2: Accuracy.
How people perform at work can be a function of what they know, and we might therefore anticipate that if test questions are answered incorrectly, we would see this reflected in inaccurate performance ‘in the real world’.
Whilst that may be true, it’s important to explore whether there could be other reasons for incorrect answers. Perhaps there was an insufficient explanation of a topic for the right answer to be obvious? Or maybe a question was framed in a way that made it seem ambiguous?
Moreover, interrogating real-world behaviour can shed light on the issue. Dig into the trends. If most people are answering a question incorrectly, it might flag up a need to investigate what behaviours are authentically occurring during the task in question.
If the majority of people are consistently answering questions incorrectly and the real-world behaviour is incorrect, then you’ve identified a knowledge gap that can be solved by updating the training.
Doing this can be game-changing. We’ve helped convenience retail clients identify knowledge gaps that exposed them to real reputational risks and fines, simply by looking at the data on incorrect answers and modifying the learning to improve knowledge of specific laws.
Metric 3: Judgement.
It’s rare that a learning intervention can prepare employees for all possible situations. Instead, we’re developing their ability to think critically and make appropriate judgement calls when faced with unknown circumstances.
To build this capability, we can produce authentic scenarios that deliberately introduce nuance to interrogate decision-making skills.
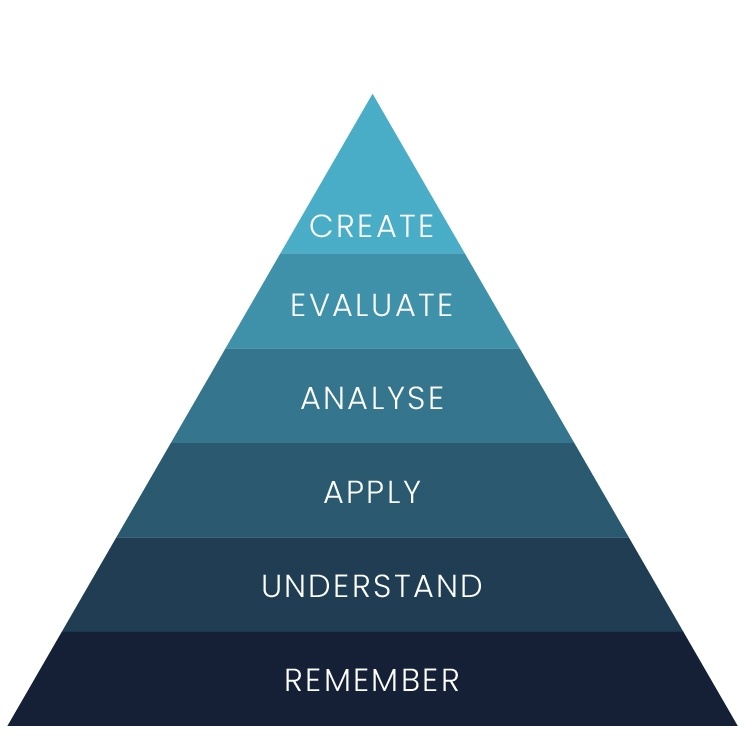
By writing questions that assess recall (the first tier of Bloom’s taxonomy, see left), understanding, and application, we can assess higher levels of ability in a given domain.
For example, working with a global pharmaceutical company, we saw that people could easily answer the level one and two questions regarding information sharing, creating an impression of competence. However, they began to struggle at level three – answering questions that tested their ability to make important judgement calls in less clear-cut circumstances.
By gathering responses to nuanced questions, L&D leaders can anticipate which behaviours are likely to transfer under similar circumstances at work.
Metric 4: Geography.
Global L&D teams and business directors responsible for skilling are often tasked with rolling out training that’s resonant and applicable across corporate locations. As such, learner locations become incredibly valuable as a lens to assess performance through.
For instance, if we see that learning in one location is taking a lot longer than in other areas, we can use this information to discuss better support for that region with a more accessible, or localised offering.
Alternatively, we might identify people that are not completing learning by location, enabling us to target tailored support for that region.
If you’re interested in learning whether your culture and values are aligning with everyone across your company, use geographic metrics to look for indicators. Whilst these may come from your LMS, we’ve found that other platforms, like Workplace, can offer tangible indicators on engagement at a global scale, leading to striking results.
Metric 5: Engagement.
One metric that is always enticing is engagement – to what extent are people truly absorbed in the experience and gaining relevant, actionable meaning from it?
The science of learning makes it clear that engagement is the gateway for learning, a fundamental pillar without which no learning will occur.
One way to measure engagement is to look at the uptake of ‘stretch’ content. By creating programmes with optional learning and looking at who voluntarily takes it, we can identify those individuals and groups with a thirst for the topic.

Other ways to measure learning engagement include:
- Discussion: to what extent are people engaging with others about the subject?
- Sharing: how many times has a course or resource been shared, recommended, or liked?
- Reviews: what are people saying about the course in feedback surveys?
- Traffic: how busy and well-used are leaderboards or league tables?
- Rewards: to what extent have badges or rewards been earned for participation?
- Sign-ups: what is the volume of sign-ups for non-mandatory courses?
- Drop-offs: what does the drop-off rate look like for non-mandatory courses?
- Application: what percentage of employees are using their new skills? (This may be detected from manager polls, self-report surveys, peer-surveys, performance KPI’s)
It can be easy to think that with some learning – often in compliance – people want to get it over and done with as soon as possible.
But our work with clients has consistently shown us that when presented with optional learning tasks, many people chose to continue because they are interested and curious. This data contributes to a broader picture of employee engagement and can influence progress discussions and promotion suitability.
Making the most of the metrics going forward.
Tracking these five metrics – time, accuracy, judgement, geography, and engagement – is a strong position to be in for most L&D teams.
They may seem like easy metrics to track – and we hope that in most cases they are – but when you start to put them together, viewing them at a global level across all your programmes, you’ll begin to build up a picture of what’s really going on.
This type of analysis would place your data capability at the proficient level, meaning you stand in good shape to get to the next stage, data savvy, where you’ll be looking to predict risks.