Wie Sie den Reifegrad Ihrer Lerndaten verbessern können (engl.)

This month, we’re excited to launch ‘Expert Views’ - our new and exclusive video interview series hosted by Sponge co-founder Kate Pasterfield, where we invite subject matter experts from Sponge, and the wider digital learning arena, to share their insights on the latest industry challenges.
To kickstart the series, we’ve invited Zach Romain, our Head of Product Innovation, to the interview seat to discuss learning data maturity and the steps to consider to progress your learning analytics.
In this interview, we’ll cover:
- Data maturity and what this means for L&D
- Useful models to assess your data maturity
- Practical steps to advance your data maturity
- Data savvy questions your L&D teams should be asking
- How to improve data maturity in practice
- The tech you need to provide essential data insights
- Advice for L&D teams on how to get started
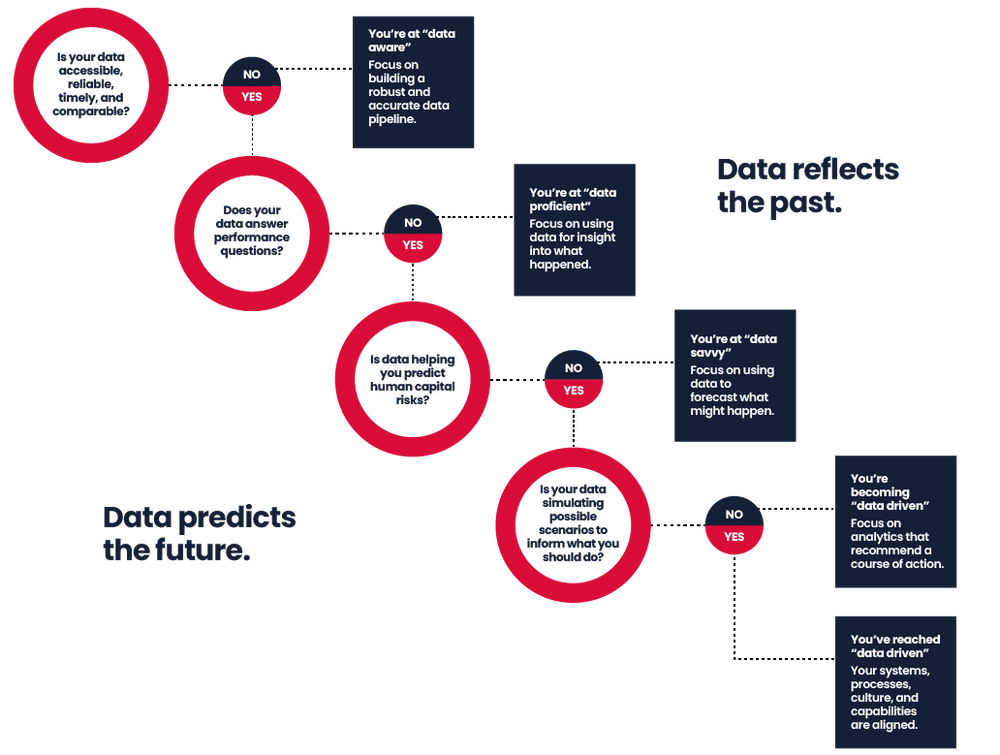
From data aware to data-driven.
How do you progress your learning analytics to achieve actionable insights? Watch Zach Romain, Head of Product Innovation at Sponge, guide us through the various stages of the data maturity scale.
The stages of the data maturity scale.
To put it simply, many organisations have not yet reached data maturity when it comes to learning analytics. Across many organisations we work with, we see that the appetite to gain actionable insights from data outstrips the ability, processes, and structures to do so.
Many clients are at the first stage: ‘data aware’. They are tracking data, but they’re not necessarily tracking the right information to answer stakeholder questions. And in many cases, they’re overwhelmed by data: tracking far too many data points to be able to analyse and interpret them effectively.
Others find themselves at the next stage; ‘data proficient’. They’ve developed sophisticated approaches to using data and can see the connection to business impact but are unable to anticipate performance blind-spots.
Beyond that, the two higher levels of data maturity, known as ‘data savvy’ (the ability to predict performance behaviour), and ‘data driven’ (where no decision is made without data), are simply out of reach for many L&D teams currently.
Where do you see your organisation on the scale? Which stage do you identify with most? Use the infographic to assess your data maturity position. Read our essential guide to Learning Analytics to help you succeed in 2022.
Assess your data maturity.